Making Sense of a Large Data Set: The Everyday Benefits of GIS on Project Data Sets by Justin Kellogg
March 29, 2017
Traditional noise study methods using 3-ring binders, notes on paper maps, and spreadsheets can be onerous with large data sets. For years now, our clients have appreciated Watts’ GIS capabilities and the increased efficiency and versatility that we provide.
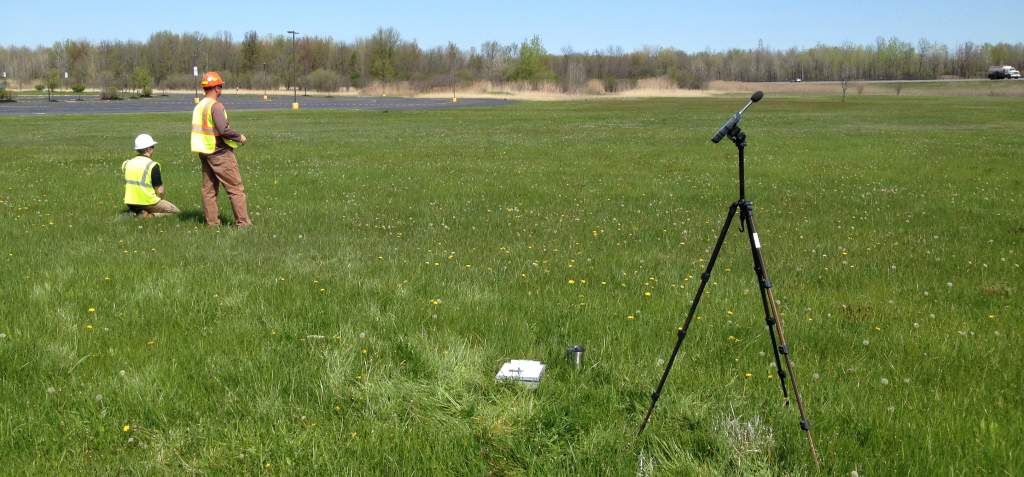
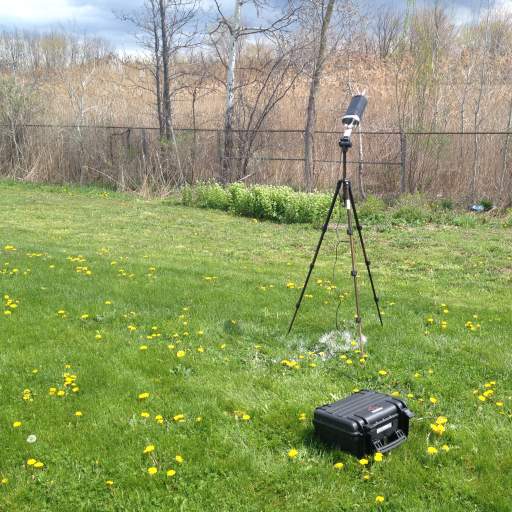
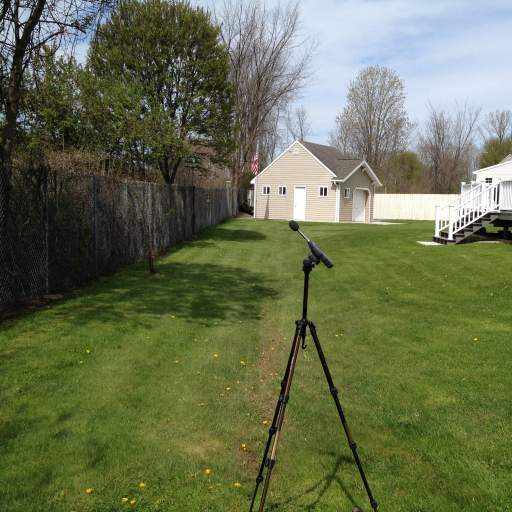
Watts is providing environmental assessment services and detailed studies for the New York State Department of Transportation for Preliminary Design Services (Phases I-IV) for a major roadway and bridge corridor reconstruction project located in Onondaga County. Two build alternatives were progressed for this project that would potentially affect over 40 miles of traffic including I-81, I-481, I-690 and much of the downtown Syracuse street network. Among other services, Watts performed a noise study including noise measurement and noise modelling for the project’s Environmental Impact Statement (EIS). The noise analysis involved numerous long term (24-hour) field noise measurements, short term field noise measurements and computer modeling of approximately 2,240 noise receptors.
Computer noise modeling was performed using FHWA Traffic Noise Model (TNM) throughout downtown Syracuse and its suburbs. The modeling was performed for the existing conditions and two future build alternatives for the year 2050. The model results yielded over 6720 noise levels to review, assess, and present. While a spreadsheet with 6720 results is hardly comprehendible to anyone, a visual representation of the results can convey information and trends at a glance. Therefore, the use of a Geographic Information System (GIS) interface was the obvious choice for this project.
The GIS database structure for this project required numerous populated fields for each of the receivers including: existing and proposed decibel (dBA) levels, addresses, municipalities, field measurement datum, and land use activity categories. It is often assumed that it takes double the amount of time to present data in a GIS format because GIS is frequently an afterthought. However, by incorporating GIS into the project workflow at the beginning, it was much more efficient than traditional data collection methods and ultimately offered many more options for information assessment and presentation.
One of the benefits of using GIS for this project was a more streamlined workflow since each receiver was digitally placed on a map once (either in the field on an iPad/iPhone or in the office on a desktop computer) instead of the traditional method of using 3-ring binders, notes on paper maps, and spreadsheets. Associated note fields were digitally completed, in the field or office, for each receiver and the address fields were automatically populated by a GIS geolocation tool. In addition, the 6720 TNM computer modelling results were digitally sorted and imported into the appropriate fields of the GIS database. Once the information was available within the GIS database, it could be reviewed spatially as an overview on an air photo/map or in detail by the click of a point on a map.
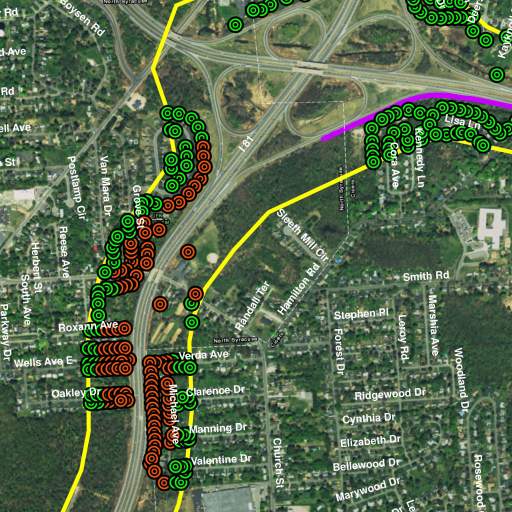
The GIS format allowed Watts to efficiently spot trends, make conclusions, and make at-a-glance interpretations of noise effects related to other tasks such as historic land use and social effects. The GIS format also allowed for an interactive presentation that was given at a project meeting in Albany. For the EIS, a set of figures was generated for each alternative that showed receivers predicted to have noise impacts in red and non-impacted receivers in green. The red noise-impact-points shown on the maps made it apparent as to where noise walls should be considered. The red and green identifiers were assigned globally via attribute as opposed to individually in CADD. This visual representation of the data made it obvious where the predicted noise impact areas were located. Over 65 EIS figures were generated from the noise GIS data. In addition, a 52 page table of the results, sorted by address, was also exported from the GIS database to allow for a non-digital way of accessing data for individual addresses.
While it is easy to see the benefits of GIS for large data sets, GIS can also offer the same benefits while being more efficient than traditional methods for small to medium sized data sets. Since our implementation of GIS here at Watts, years ago, our clients have appreciated the versatility of our deliverables and our ability to rapidly identify key trends within our project data.


